


|
|
Home | Products | Issue Tracker | FAQ | Download |
|
|
The GRID object can be used to add labeled graticule lines to your map. Initially developed in 2003 by John Novak, the GRID object is designed to be used inside a LAYER object to allow multiple GRID objects for a single map (allowing for example: a lat/long GRID, a State Plane GRID, and a UTM GRID to be displayed on the same map image).
LAYER
NAME "grid"
METADATA
"DESCRIPTION" "Grid"
END
TYPE LINE
STATUS ON
CLASS
NAME "Graticule"
COLOR 0 0 0
LABEL
COLOR 255 0 0
FONT "sans"
TYPE truetype
SIZE 8
POSITION AUTO
PARTIALS FALSE
BUFFER 2
OUTLINECOLOR 255 255 255
END
END
PROJECTION
"init=epsg:4326"
END
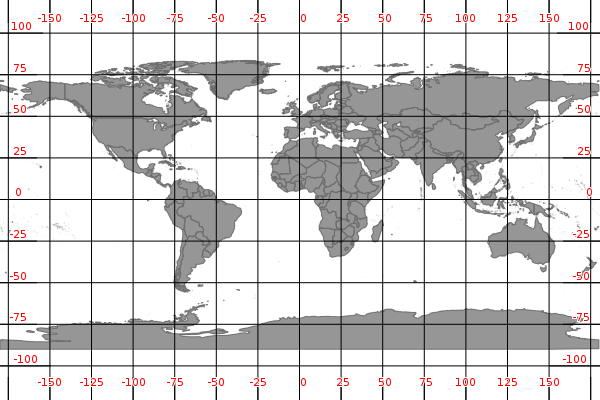
GRID
LABELFORMAT "DD"
END
END # Layer
LAYER
NAME "grid"
METADATA
"DESCRIPTION" "Grid"
END
TYPE LINE
STATUS ON
CLASS
NAME "Graticule"
COLOR 0 0 0
LABEL
COLOR 255 0 0
FONT "sans"
TYPE truetype
SIZE 8
POSITION AUTO
PARTIALS FALSE
BUFFER 2
OUTLINECOLOR 255 255 255
END
END
PROJECTION
"init=epsg:4326"
END
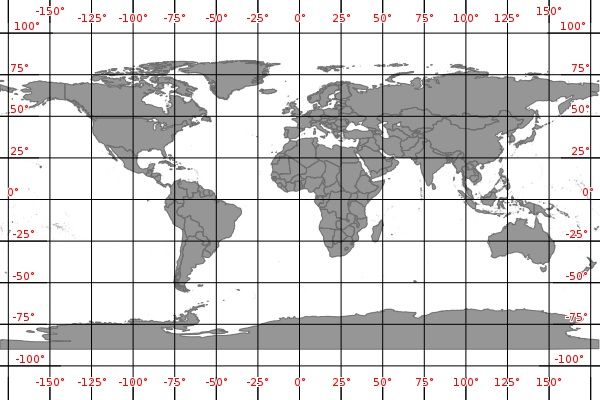
GRID
LABELFORMAT '%g°'
END
END # Layer
LAYER
NAME "grid"
METADATA
"DESCRIPTION" "Grid"
END
TYPE LINE
STATUS ON
CLASS
NAME "Graticule"
COLOR 0 0 0
LABEL
COLOR 255 0 0
FONT "sans"
TYPE truetype
SIZE 8
POSITION AUTO
PARTIALS FALSE
BUFFER 2
OUTLINECOLOR 255 255 255
END
END
PROJECTION
"init=epsg:3857"
END
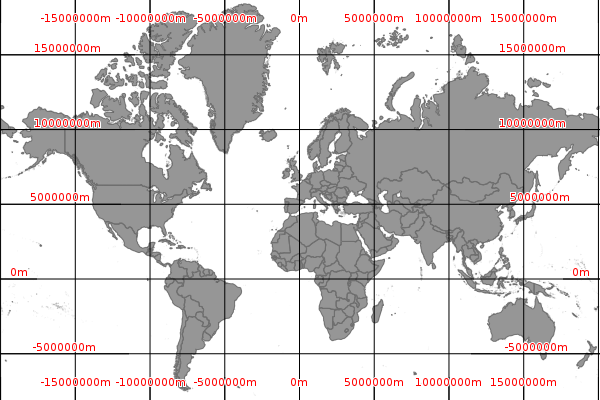
GRID
LABELFORMAT '%.0fm'
MININTERVAL 5000000
END
END # Layer
注解
Pay attention to the values you use for the INTERVAL parameter; it is possible to confuse/overload MapServer by telling it to draw a graticule line every meter (MININTERVAL 1).